If you’re not already using Instagram Reels, let’s be honest: you’re falling behind. At its core, creating a Reel is simple—you’re just pairing short video clips with some text, music, and maybe a few effects, all inside the Instagram app. The process is pretty straightforward: record or upload your video, layer on your audio and text, and then push it live with a good caption and the right hashtags.
It’s designed to be fast, fun, and, most importantly, incredibly discoverable.
Why Your Business Has to Master Instagram Reels

Before we get into the nitty-gritty of how to make a Reel, we need to talk about why this isn't just another shiny object to chase. Instagram has completely changed. It’s no longer a quiet album of filtered photos; it's a loud, bustling, video-first discovery engine.
And what's fueling that engine? Reels. The algorithm is practically force-feeding them to new audiences, giving you a shot at organic reach that’s become almost mythical for other types of content.
For busy founders, experts, and marketers, this is a golden opportunity. Forget the viral dances. This is about using a powerful communication tool to genuinely connect with the people you want to serve.
The Undeniable Power of Short-Form Video
Don't just take my word for it—the numbers are screaming it from the rooftops. As of early 2025, Instagram Reels make up a massive 38.5% of all Instagram feed posts. Think about that. Just a few years ago, back in 2020, that number was a mere 5%.
This isn't just a trend; it's a fundamental shift in how people consume content on the platform.
Even better, Reels get twice as many impressions as other content types. That means your simple video sharing a few industry tips can reach a far bigger audience than a beautifully crafted carousel post ever could.
This reach directly translates into real business results:
- You become the go-to expert. Sharing what you know, consistently, cements your authority in your field.
- You put a face to the name. Reels let people see the real you, building the kind of trust and connection that a logo never can.
- You get people talking. The format is built for comments, shares, and saves—all the signals that tell the algorithm your content is worth showing to more people.
This isn't about chasing one viral hit. It's about building a repeatable system to share your authentic voice and turn what you know into a reliable engine for growth and leads.
A Smarter, Faster Way to Create Content
I get it. The biggest thing holding most people back is the thought of how much time it all takes. The good news? You don't need to be a video editor or spend hours hunched over complicated software.
The secret is to split your workflow in two: the creative part (you, sharing your ideas) and the technical part (the editing).
Focus on batch-recording your raw thoughts and then hand off the heavy lifting to smarter editing solutions. For example, a service like Unfloppable can take your raw footage and turn it into polished, engaging, ready-to-publish videos, freeing you up completely.
This is how you build a sustainable content machine. You focus on your zone of genius—sharing your expertise—while still producing professional content that actually gets results. And that's exactly the system I'm going to walk you through.
Crafting Your Content Strategy Before You Press Record
The best Instagram Reels look effortless, but I'll let you in on a secret: they’re almost always the result of a solid plan. Before you even think about hitting that record button, you need a clear strategy. This isn't about stifling your creativity—it's about focusing it, making sure every single video you create actually does something for your business.
The first mental shift you need to make is to stop thinking about what you can post and start thinking about what problems you can solve. People aren't scrolling Instagram to see a sales pitch. They're there to learn something new, be entertained for a moment, or feel like someone gets them. Your Reels need to deliver on that promise.
And the numbers here are just too big to ignore. A staggering 50% of time spent on Instagram is now dedicated to watching Reels, and with 2.35 billion people tuning in every month, the opportunity is absolutely massive. This isn't just passive viewing, either; 90% of users are actively engaging. Reels are, without a doubt, the main stage for capturing attention right now. You can dive deeper into how Reels are dominating the platform with these 2025 Instagram marketing statistics.
Brainstorming Ideas That Actually Resonate
To create Reels that people genuinely connect with, you have to dig deeper than surface-level topics. A great starting point is to identify your core content pillars. Think of these as the handful of foundational themes you could talk about all day long.
What does that look like in practice? Here are a few to get you started:
- Your Secret Sauce: How do you get incredible results for your clients? Break down a piece of your unique process.
- Myth-Busting: What's a widely accepted "truth" in your industry that is just plain wrong? Call it out.
- Client Wins: Share an anonymized success story that showcases a real transformation.
- Quick & Actionable Tips: What's one small piece of advice someone could use today?
For instance, if you're a SaaS founder, your pillars might be "Productivity Hacks," "Feature Spotlights," and "Startup Lessons." Suddenly, you have a wellspring of endless Reel ideas that are all perfectly aligned with your expertise and your brand.
The goal isn't just to create one viral video. It's to build a library of genuinely valuable content that cements your status as the go-to authority in your niche, one 30-second Reel at a time.
Scripting for the Scroll
Once you have a solid idea, the next step is scripting. And no, this doesn't mean writing a word-for-word monologue. In my experience, a simple bullet-point outline works far better because it helps you sound natural and authentic on camera.
Every single high-performing Reel I've seen follows a simple three-act structure:
- The Hook (First 3 Seconds): This is non-negotiable. You must grab their attention immediately. Kick things off with a polarizing statement, ask a direct question, or make a bold promise. Something like, "Stop making this one mistake with your cold emails."
- The Value (The Middle): This is where you deliver on the hook's promise. Give them 2-3 quick, actionable points. The key is not to overwhelm them. Keep it concise and punchy.
- The Call-to-Action (The End): Tell them exactly what to do next. Don't leave them hanging. A clear CTA like "Comment 'GUIDE' for my free template" or "Save this Reel for later" is what drives real engagement and moves people closer to your business.
To help you put this into practice, here’s a simple framework breaking down how you can structure your Reels to meet different business goals.
Reel Hook and Script Framework
| Goal | Hook Example | Script Structure | Call to Action Example |
|---|---|---|---|
| Build Authority | "Here’s the #1 reason your marketing isn't working..." | 1. State a common problem. 2. Debunk a myth. 3. Provide the correct solution. | "Follow me for more no-nonsense marketing tips." |
| Generate Leads | "Want my free 5-step checklist for [Goal]?" | 1. Announce the free resource. 2. Quickly explain what's inside. 3. Show a sneak peek. | "Comment 'CHECKLIST' below and I'll send it over." |
| Promote a Product | "3 ways our [Product] solves [Pain Point]." | 1. Hook with the problem. 2. Demo 3 key features. 3. Show the final result/benefit. | "Ready to try it for yourself? Tap the link in my bio." |
| Increase Engagement | "What's your unpopular opinion about [Industry Topic]?" | 1. Ask a controversial or open-ended question. 2. Share your own opinion briefly. 3. Invite comments. | "Let me know what you think in the comments!" |
Using a framework like this transforms a random idea into a strategic piece of content built to perform. It's the real difference between just posting something and posting with purpose.
You Can Shoot Incredible Reels With Just Your Smartphone
Forget the idea that you need a professional camera crew to make high-performing Reels. Seriously. The phone you're holding right now is a powerhouse, but only if you nail the three things that separate amateur video from content that looks polished and credible.
The biggest mistake I see people make is just hitting record without even looking at their environment. Before you do anything else, take a second to check your surroundings. It all starts with the most critical element: light.
Get Your Lighting and Audio Right
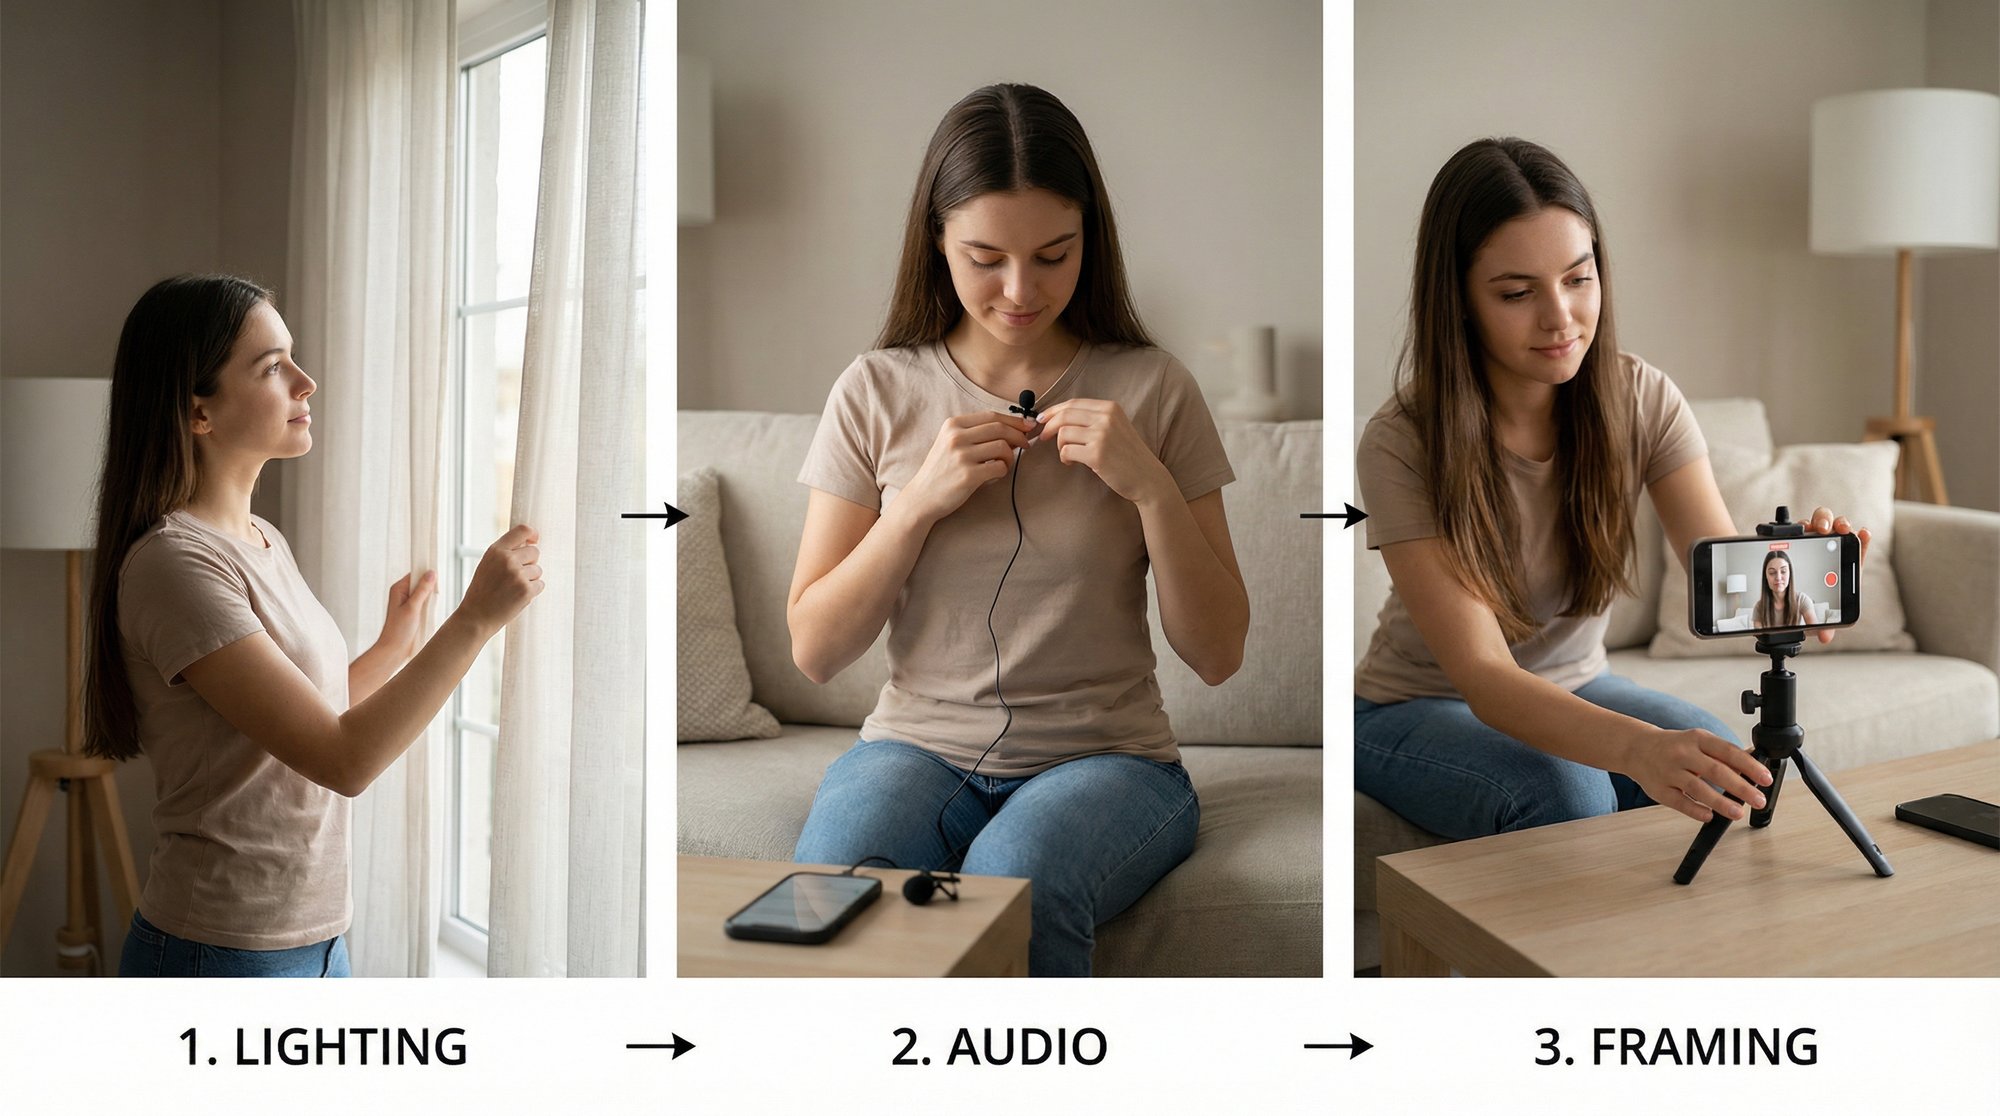
Great lighting is the quickest way to make your video look a million bucks. You don't need fancy, expensive ring lights either. The best light source is totally free. Just find a window and face it. That soft, natural daylight will light up your face perfectly, get rid of weird shadows, and give your video an instant quality boost. It's that simple.
Next up, audio. People will put up with video that's a little grainy, but bad audio? It’s an instant scroll. If you sound like you’re in a tin can or miles away from the phone, you’ve lost them. A cheap lavalier mic is a fantastic investment, but you can get clean audio just by recording in a quiet room. Look for a space with soft surfaces—curtains, a rug, even a bed—to soak up any echo.
Here's what you need to remember: Bad lighting makes you look unprofessional, but bad audio makes your content literally unwatchable. If they can't understand you, your entire message is gone. Prioritize clear sound above everything else.
Nailing Your Framing and On-Camera Vibe
Okay, your lighting and audio are sorted. Now, let's frame the shot. Ditch the shaky, handheld look by propping your phone on a stack of books or grabbing an inexpensive tripod. Make sure the camera is at eye level. Looking down on the camera is never a flattering angle, and looking up at it just feels awkward for the viewer.
Here’s a simple pro tip for framing: use the rule of thirds. Picture your screen split into a 3x3 grid. Instead of dead-centering yourself, line yourself up with one of the vertical lines. It instantly makes the shot feel more dynamic and professional.
Feeling weird on camera is totally normal. I get it. The trick is to stop trying to memorize a script word-for-word. That always comes across as stiff and robotic. Just use the bullet points from your script and talk like you're explaining something to a friend. Be natural.
Finally, the real secret to staying consistent without burning out is batch recording. Block out an hour or two once a week and film all your raw clips in one go. This is an absolute game-changer. You get into a rhythm, build up a bank of footage, and suddenly you have content ready to edit for days or weeks, without the daily pressure of having to film.
A Smarter Editing Workflow That Saves You Hours
Let's be honest: editing is the great bottleneck of content creation. It’s that black hole where your brilliant, batch-recorded ideas can get stuck for weeks, slowly losing their spark and momentum. I've seen countless founders and experts burn out right here, bogged down in the tedious grind of cutting clips, adding captions, and hunting for b-roll.
But what if you could just… skip that part?
This isn’t about creating some synthetic, AI-generated avatar that feels completely disconnected from your brand. It’s about taking your authentic, talking-head footage and pairing it with smart technology that acts like a world-class editor. This is the secret sauce for producing a high volume of quality content without the soul-crushing grind.
Let Smart Technology Do the Heavy Lifting
Picture this workflow: you film your raw video, upload it, and a little while later, you get back a polished, ready-to-post Reel. This isn't science fiction anymore. Services like Unfloppable are built specifically to take the most time-consuming parts of the editing process off your plate.
All you do is provide your spoken footage, and the platform intelligently handles the rest.
- Dynamic B-Roll: It finds and inserts relevant stock video and images that visually match what you're saying, making your content way more engaging.
- Internet Connected: It pulls in relevant text, images, or video from the web, so you can talk about news, articles, or stats and see them appear in the final video.
- Smart Text Overlays: It adds perfectly timed, animated captions that keep viewers hooked, especially the 85% of people watching with the sound off.
- Personalized Media: You can even let it search through your own library of photos and videos, pulling in the exact 2 important seconds of footage of your products, team, or past events to make the final Reel feel uniquely yours.
The real magic of this workflow is its simplicity. It separates the creative act of sharing your expertise from the technical chore of video editing. This frees you up to focus entirely on what you do best—delivering value to your audience.
This is what the Unfloppable interface looks like. You can see how raw footage gets transformed into a dynamic, visually engaging Reel. By automating the hunt for relevant b-roll and adding dynamic text, the platform hands you back hours of your life.
From Raw Footage to Polished Reel in a Fraction of the Time
This whole approach is about building a sustainable system for your content. When you know that editing is handled, the mental barrier to hitting "record" completely vanishes. You can confidently batch-record a month's worth of ideas in a single afternoon, knowing every single clip will be turned into a professional-grade asset without you lifting a finger in a timeline.
Focus on getting the raw material right, and let the tech handle the rest. Just nail these three fundamentals when you shoot:
- Good Lighting
- Clear Audio
- Solid Framing
Getting these three things right gives the automated editing process a high-quality foundation to build on, ensuring your final product looks fantastic.
This is exactly how top creators maintain such a consistent presence without living in their editing software. They've figured out that on platforms like Instagram, consistency is just as critical as quality. Learning how to create Instagram Reels efficiently means building a system that allows you to show up day after day, building trust and authority. This smarter approach finally makes that level of consistency achievable for anyone.
Writing Captions and Hashtags That Amplify Your Reach
Alright, your Reel is polished and ready to go. But wait—your work isn't quite done. While the video is what stops the scroll, your caption is what turns a casual viewer into an actual follower. So many creators just slap on a sentence and call it a day, but that’s a huge missed opportunity. Your caption is your best tool for signaling to the algorithm that your content is worth pushing.
Think about it: when someone takes the time to read your caption, leave a comment, or hit that "save" button, they're sending powerful social signals to Instagram. These interactions are gold. They tell the platform your content is hitting the mark, which encourages it to show your Reel to more and more people. This is how a simple video becomes a real business asset.
Crafting Captions That Convert
A truly effective caption has a clear job to do. It needs to grab attention immediately, expand on the promise of your Reel, and then tell people exactly what you want them to do next. You have to earn their attention, line by line.
Kick things off with a bold opening line. This first sentence is your second hook—it should either build on the video's initial hook or spark a new wave of curiosity. Remember, this is all people see before they have to tap "...more," so don't bury the good stuff. Make it irresistible.
From there, it's all about delivering value. This is your chance to add more context, share a quick personal story, or break down the why behind the tips in your video. Keep your paragraphs short and punchy. Nobody wants to read a wall of text on mobile, so use line breaks, bullet points, and even emojis to keep it scannable and easy on the eyes.
The single most overlooked part of any caption? A clear Call-to-Action (CTA). Seriously. Never, ever assume your audience knows what to do. Spell it out for them: "Save this for later," "Drop your thoughts in the comments," or "Share this with a friend who needs to see it."
Demystifying Your Hashtag Strategy
Hashtags aren't just a handful of keywords you toss at the end of your caption. When used correctly, they are a powerful discovery engine connecting your content with people actively searching for it. The secret is to blend different types of tags to cast a wide net without getting lost in an ocean of competition.
I like to think of a hashtag strategy as a pyramid.
- Broad & Popular (The Peak): Stick to just 1-2 massive tags like
#marketingtipsor#entrepreneurlife. These have incredible reach but the competition is fierce. It’s a lottery ticket, but one worth having. - Niche & Specific (The Middle): This is your sweet spot. Use 3-5 tags that laser-focus on your topic or ideal audience, like
#saasmarketing,#startupfounder, or#contentstrategy. This is where you’ll attract a much more qualified and engaged viewer. - Branded & Unique (The Base): Always include 1-2 tags that are all yours, like
#UnfloppableTips. This helps build a community and makes it easy to track conversations specifically about your brand.
By layering your tags this way, you create multiple pathways for your Reel to get discovered. The broad tags give you a shot at going viral, while the niche tags ensure you’re reaching the right people—the ones who are most likely to stick around. This balanced approach is absolutely key to learning how to create Instagram Reels that consistently find new audiences.
Answering Your Biggest Questions About Making Reels
Even with the best game plan, you're going to have questions once you start making Reels. That's totally normal. As a founder or expert, you don't have time to guess—you need clear answers to get it right. Let's tackle the most common questions I hear from people just like you.
How Long Should My Instagram Reels Actually Be?
Instagram lets you post videos up to 180 seconds, but let's be real: for business content, that's way too long. The magic number is almost always between 15 and 30 seconds.
Think of it this way: you have just enough time to land one powerful idea, solve one specific problem, or share one quick win. That’s it. Anything longer and you’re fighting against your audience's notoriously short attention spans.
The algorithm is looking for two main signals: total watch time and replays. A short, punchy Reel is far more likely to get watched all the way through—and then watched again. Get straight to the point and pack all the value into those first few seconds.
A tight, re-watchable Reel will beat a long, rambling one every single time. Respect your audience's time, and the algorithm will reward you for it.
So, When Is the Best Time to Post Reels?
The honest—and slightly frustrating—answer? It depends. The best time to post is whenever your specific audience is scrolling. There's no one-size-fits-all magic hour.
Your best bet is to check your Instagram Insights. Head over to the "Audience" tab, and Instagram will literally show you the days and hours your followers are most active. That data is gold.
If you’re just starting out and don't have much data to go on, here are a few solid starting points:
- Lunchtime: Think 12 PM - 2 PM in your primary time zone.
- Evenings: Usually 7 PM - 9 PM, when people are kicking back after their day.
But here’s the real secret: consistency matters way more than perfect timing. Get into a good posting rhythm first. Once you're consistently showing up, you can start tweaking your post times based on your analytics to squeeze out even more engagement.
Do I Really Have to Use Trending Audio?
Nope. In fact, for most experts and founders, I'd argue you shouldn't.
Sure, a trending sound might give you a quick, unpredictable bump in views, but it’s a cheap high. It's not a real strategy for building a credible brand. It’s like building your entire business on someone else’s property—the foundation is shaky at best.
Your most powerful tool is your original audio. It’s your voice, your personality, and your unique perspective. The algorithm is getting smarter and is actively rewarding original, valuable content. When you use your own voice, you build authority and trust. You attract an audience that’s there for you, not for a 15-second audio clip that will be forgotten tomorrow. That kind of connection is priceless.
How Do I Keep Making Reels Without Burning Out?
Burnout is the enemy of consistency, and it almost always comes from a clunky, inefficient process. The solution isn't to work harder; it's to work smarter.
Here’s the system that works: separate your creative brain from your technical brain.
Set aside one block of time each week to batch-record all your talking-head videos. Don’t worry about editing, captions, or anything else. Just get in front of the camera and share your ideas.
Then, hand off the most soul-crushing part of the process: the editing. Using a service to turn that raw footage into polished, ready-to-post videos is a game-changer. Content creation suddenly goes from a nagging daily chore to a simple, scheduled task. You just talk, upload your clips, and post the finished product when it comes back. That's how you stay in the game for the long haul.
Stop letting video editing kill your momentum. Unfloppable transforms your raw ideas into perfectly polished Reels, saving you hours every single week. Now you can focus on what you do best: running your business. Try it for free and see just how easy consistency can be.